After the user has set up some structure in the database, it supposedly uses some form of “AI” in order to determine the best “fit” for incoming data and will automatically place the new file accordingly.
It can also search the web for content similar to the current document.
It is quite rough around the edges and isn’t likely a heavy hitter like DTPro but it does offer the visualization option, which is it’s most appealing feature, IMO.
I wanted to post it as an example and because I thought I saw some familiar handles in the macupdate review section.
Is something similar still being considered for DTPro?
Anyone else have an opinion on how some of those/similar features might augment DTPro
I tried and failed (repeatedly) to get TouchGraph integrated with my MediaWiki, back in the day (aka last month). That was functionality I liked – the way I wanted to “see” my categories. Really, it’s an important way to look at data, equally as important in my eyes as a folder hierarchy.
It’s all fine and dandy to have Category > Subcategory > Subsubcategory > Document. In fact, that’s the primary reason I moved from MediaWiki to DT Pro. But on the other hand, there are a lot of folders that are six or more levels deep in my hierarchy that should also be on the root level. And there are folders on the root level that should be many levels deep. Sometimes, I want to look at a given group’s relationship to another group – how they intersect, common elements, missing links that I need to create. I want a high amount of symmetry and interconnectedness in what I do, and visualizing it is the best way to do so.
Any sort of visualization would be nice, even if doesn’t spin and whirl and reform like Touchgraph. I wouldn’t mind creating, say, a GraphViz graph, if it weren’t for the fact that there are several steps involved, for instance piping the PS script through Acrobat to create a PDF with links because of PDFKit’s frailties.
A visualization engine of some sort has been my pipe dream since I first downloaded DTP. Or, failing that, some sort of plugin architecture that might be able to allow enterprising users to integrate the apps they like. That might make everyone happy.
i’m sure there are a lot of dt-user that would love to see the database-structure visualized. think of all the people in the (photo-)graphic and design business. they are accustomed to work in a more visual way.
i tried so much mind-mapping-apps. it would be great if dtp would offer me the ability to work in just one application from the first idea to the final concept.
It’s not really mind-mapping in the strict sense, but you might like the OS X port of GraphViz. It has a service, so you can create the “source” for the flow chart (easy) and then select it all and pipe it through the service. It renders beautifully.
It’s not a real mind map because it’s not really real-time or anything, and you can’t just pick and choose where to put things – but having the program decide where to put the bubbles actually works better for me. I spent most of my time with actual mind maps moving the damn bubbles around…
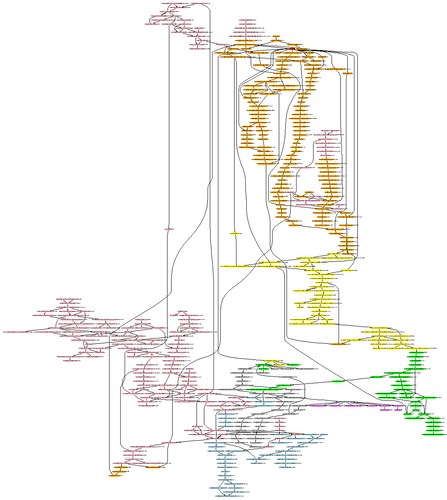
I did this (partial) plot map of the series of books I’m working on in GraphViz (scaled down immensely):
It took only a second or two to render on an iBook G4. Of course, there are other complications. The language used to connect bubbles together goes like this:
"A" -> "B";  ### Creates A and B, since they have not been mentioned before, and draws a line with an arrow between them.
"A" -> "C";  ### Creates C and draws a line from A to C.
So the obvious problem is that as the text displayed on each bubble gets longer, that’s a lot more stuff that you have to remember to type perfectly… or else you’ll create another bubble with that description and your chart will get messed up. And with more items, it gets harder to detect messups…
So it’s definitely not a perfect solution. But it’s free, automatic, simple, and neat And you can export it to anything.
shrugs It’s worth a try anyway, if you haven’t used it.
If DevonAgent can create a topic map from HTML links then why can’t it do the same using the hierarchical group structure of a DevonThink database (treating replicants as de facto links)?
My ideal scenario would be one in which DT’s three-pane view displayed a selected file at the centre of a “topic map”. Each node in the map would simply be a file name (or maybe a thumbnail, depending on the media type and on user preferences). The user would be able to specify the depth of links visible around the selected node.
Clicking on a node would display the contents of the related file in the pane beneath. Dragging files from the Classify drawer (or, indeed, from a new window or even a separate database) to a specific node would create new links (i.e. new replicants), which would instantly be visible as lines.
Why would all this be useful? Because it would allow you to browse your collected knowledge in an associative manner, rather than via the rigid hierarchies of the group system. Also, unlike the column view, it would enable you to see files several links away from your position in the database at all times. This would conceivably boost your creativity as you spotted associations that you’d otherwise miss.
In effect, it would create a kind of “concept map” in which groups were linking phrases and the files inside them were concepts (To learn about the difference between concept-mapping and mind-mapping, take a look at this: http://en.wikipedia.org/wiki/Concept_map).
I know the developers are burdened by DTP2, DTPO, DA, and so forth, with a lot of feature increments expected by their ever-fanatical userbase. As Bill has pointed out many times, DTP can’t be all things to all people.
I don’t mind DTP staying much like it is. I have to say, though, that I’d cheerfully pay for a DEVON-branded graphing app whose files could be viewed and maybe even manipulated in DTP. (Or just a really large plugin). Omni-Graffle Pro is, what, $60? I’d happily pay that much for a plugin, just to be able to do mind-mapping/concept-mapping/timelines/family trees/etc all in DTP.
Not only that it can create automatically a map, no, it also allows you to create new notes and integrate them into the map which is reflected in the file system. GREAT! Also you can add comments and annotate links between nodes in the graph.
Ultimately the map is a graph rather than a strictly hierarchical tree to be honest, showing “black/hard” links for hierarchical connections and “grey/soft” links for symbolic links into different folders to create a proper MAP.
My brain works like a map (not like a mindmap though! I like graphs much more!) and it would be amazing if devonthink could simply add a visualisation layer. It wouldn’t cost that much anyway and it would be fairly simple to do.
Second MindNote is amazing in the sense you can attach selected folders to the side of your screen - DOCKS. This would make it EXTREMELY fast in accessing information within devonthink. Is any feature like this planned ?
I also like the shortcuts in MindNote to QUICKLY add some information.
Overall my impression is that DevonThink needs some UI which makes data more visual. Either in the way MindNote is doing or more in the way NoteBook is working - to actually SEE you data. Not any VIEW in DevonThink does support embedded notes. You always have to click them to read. Why not having a similar view like NoteBook where various notes just show up on one page for one folder…
Just some ideas. If these things would go in, there would be no doubt about the best tool around. I would even pay more than twice as much as DevonThink costs right now … but that’s a different story.
ANY of these features are planned to make it into DevonThink2 ?
I just took a look at NoteMind. Something like that would fit DevonThink perfectly. I myself am a very visual person, and with something like that it would be very easy to visualize connections between information parts or junks, and to connect information in any way which would be appropriate for me.
Especially when working on larger research projects, the ability to connect information visually would make searching for specific parts of texts a lot easier, to quote, to work with.
Combine such a thing with the AI from DevonThink, a powerful metadata engine for every file put into DevonThink to support all metainformation available for scientific publications / journals including abstracts and so on, would take DevonThink to the next three levels, including the possibility to put notes to any document in any place of that document and the possibility to link those notes like every item or file inside DevonThink…